Time to hire is the number of days from the moment a candidate enters your process (application or first reply) to the moment they accept the offer. Time to fill starts earlier, when the vacancy is approved or opened, and ends at the same point. Time to fill is therefore always the longer of the two, and the gap between them is the time you spend finding people at all. Published benchmarks range from about 40 to 55 days for time to hire, but they start and stop the clock in different places, so only compare numbers that use your own definition.
Definitions: which clock starts where?
Both metrics end when the candidate accepts the offer. They differ at the start, and that is where most disagreements about “the right number” come from.
| Metric | Clock starts | Clock stops | Answers the question |
|---|---|---|---|
| Time to hire | Candidate applies, replies to your message or enters the pipeline | Offer accepted (some sources: contract signed) | How long does a candidate wait for our decision? |
| Time to fill | Requisition approved (some sources: job posted) | Offer accepted (some sources: contract signed) | How long does the position stay empty on our side? |
| Vacancy duration (Bundesagentur für Arbeit) | Desired start date of the registered job | Registered job is deleted because it was filled | How long do vacancies stay open in the labour market? |
Greenhouse defines time to fill as the date of the offer acceptance minus the date the requisition was approved, and time to hire as the offer acceptance minus the date the candidate entered the pipeline (Greenhouse, 24 February 2026). Randstad’s German guide ends the clock at the contract signature and calls time to hire “part of time to fill” (Randstad, 21 October 2025). The vacancy duration of the Federal Employment Agency is a third clock. It counts from the desired start date to the day a registered job is removed and includes only filled positions (Bundesagentur für Arbeit, vacancy duration by industry).
Formulas and a worked example
Time to hire = date offer accepted − date candidate entered the process. Time to fill = date offer accepted − date requisition approved. Calculate each hire on its own, then report the median for a period. A single role that sat for six months otherwise drags the mean.
Example with assumed dates for one hire: requisition approved 1 September, job posted 8 September, the hired person applies 22 September, offer accepted 24 October.
| Step | Dates | Days |
|---|---|---|
| Requisition approved → job posted | 1 Sep → 8 Sep | 7 |
| Job posted → this candidate applies | 8 Sep → 22 Sep | 14 |
| Candidate applies → offer accepted (time to hire) | 22 Sep → 24 Oct | 32 |
| Requisition approved → offer accepted (time to fill) | 1 Sep → 24 Oct | 53 |
| Difference: the time before the candidate existed | 1 Sep → 22 Sep | 21 |
In this example 21 of the 53 days passed before the hired person even entered the process. A team that only watches time to hire would never see them. Neither number includes the notice period; the start date of the new employee is a separate, later date.
Benchmarks: what is published, and how far can you trust it?
| Source | Metric | Value | Basis and caveat |
|---|---|---|---|
| Greenhouse (Feb 2026) | Time to fill | 45 days across all roles | a target Greenhouse describes as an average across roles, not a measured market value |
| Greenhouse (Feb 2026) | Time to hire | 45 days business, 55 days tech, 85 days leadership | targets by function, same caveat |
| Randstad Germany (Oct 2025) | Time to hire | about 40 to 50 days | attributed to unnamed surveys; leadership roles four to six months |
None of these is a statistic you can hold against your own data. The Greenhouse figures are recommended targets, and the Randstad range cites no study. The honest use of a benchmark is as a sanity check: if your median time to hire for a standard office role is 90 days, ask where the days go. If it is 38, the question is not “are we too slow”, but “are we losing candidates later, at the offer?” Role type matters more than any average: simple entry-level roles close much faster, skilled and leadership roles slower.
Where the days go: read the phases, not the total
A total hides the problem. Split every hire into phases and look at the longest one first.
| Phase | How to measure | Typical lever |
|---|---|---|
| Approval to posting | Requisition approved → job live | Approval path and owners agreed in advance |
| Search | Job live (or search start) → first suitable candidate | Active sourcing, talent pool, better job text |
| First review | Application → first reply | Triage rule with a named owner |
| Selection | First conversation → decision | Scorecard agreed before interviews, booking blocks |
| Offer | Decision → offer sent → accepted | Pay range clarified early, short offer cycle |
Our guide to reducing time to hire shows how to find the wait between handoffs, and the recruiting KPIs that tell you something put the metric next to withdrawal and offer acceptance. If the gap between time to fill and time to hire is large, the problem sits in the search phase. That is the phase where tools differ most.
Shortening the search phase with Sprad
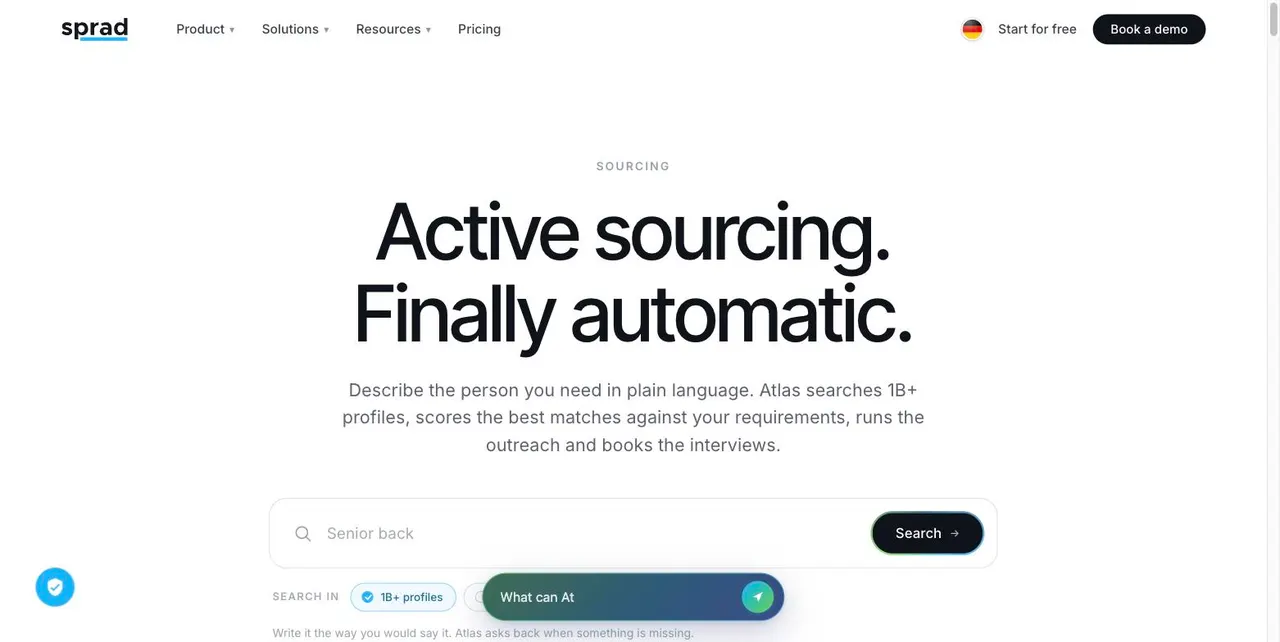
Waiting for applications is the slowest way to start the clock. With Active Sourcing in Sprad you describe the role in your own words, search public profiles and your own pool, and reach out from one inbox. A first conversation can start while the job ad is still being approved. Further down the funnel, CV screening and voice pre-interviews (12 languages) take the first review and the scheduling off the team: a CV check costs 2 credits, a voice interview 30 credits. These are inputs to your process, not a promise of a specific number of days; measure your own phases before and after. Candidates who fit but were not hired stay in your talent pool, so the next vacancy starts with names instead of an empty search.
Common mistakes when measuring
- Mixing definitions. One report counts to the offer, another to the contract signature. Pick one and write it down.
- Calendar days versus working days. Both are fine; do not compare one with the other.
- Averaging outliers. Use the median, and show the 25th and 75th percentile for a role family.
- Counting evergreen requisitions. A permanent “talent pool” posting has no real start date and distorts time to fill.
- Optimizing the number against quality. A shorter time to hire that raises early leavers is no gain. Check it against quality of hire.
FAQ
What is a good time to hire?
There is no universal figure. Published values cluster between 40 and 55 days for office roles, but they use different start and end points. Compare the same role family over several quarters and watch the median.
Is time to hire part of time to fill?
Yes, if both end at the same event (offer accepted or contract signed). Time to fill then equals the time before the candidate enters the process plus the time to hire.
Do I count calendar days or working days?
Either, but state it. Calendar days are simpler to calculate from ATS dates and are what most benchmarks use.
Does the notice period count?
No. Both metrics usually stop at acceptance or signature. The notice period decides the start date of the employee and belongs to time to productivity, not to recruiting speed.
How do I calculate time to hire in Excel?
Export the application date and the offer acceptance date for every hire, subtract the two columns, and take the median for the period. Our KPI guide shows how to collect the data without a reporting project.
Jürgen Ulbrich
Jürgen Ulbrich has more than a decade of experience in developing and leading high-performing teams and companies. As an expert in employee referral programs as well as feedback and performance processes, Jürgen has helped over 100 organizations optimize their talent acquisition and development strategies.