The most reliable social media recruiting statistics for 2026 are: 71 % of US adults use Facebook and 50 % use Instagram (Pew, 2025); 62 % of German companies use social media to attract employees (Bitkom, 2025); the median cost per applicant on Meta job ads is $13.88 (Boostpoint, 891 campaigns, 2026); and 36 % of German companies cannot fill vacancies (DIHK, 2025/2026). Every figure on this page names its source, year and country, and we say when a source is a vendor. As of October 2026.
How to read recruiting statistics
Search results for “social media recruiting statistics” are dominated by aggregator pages that copy the same numbers from each other: “92 % of recruiters use social media”, “candidates contacted directly are eight times more likely to be hired”, “73 % of 18- to 34-year-olds found their last job on social media”. We could not trace these to a named study with a method, a sample and a date, so we do not repeat them here. A statistic you can cite has four things: who measured it, whom they asked, when, and in which country.
We use three labels in the tables below: independent (statistics offices, research institutes, chambers), industry (surveys by associations) and vendor (data from companies that sell recruiting services, useful for direction, not neutral).
Reach: where the audience is
Pew Research Center surveyed US adults between 5 February and 18 June 2025. Facebook is used by 71 %, Instagram by 50 %, TikTok by 32 %, LinkedIn by 25 % and WhatsApp by 21 %. By age, Facebook reaches 68 % of 18- to 29-year-olds, 80 % of 30- to 49-year-olds and 74 % of 50- to 64-year-olds. Instagram reaches 80 % of those aged 18 to 29, 62 % of 30 to 49 and 40 % of 50 to 64.
| Statistic | Value | Source, year, country | Type |
|---|---|---|---|
| US adults using Facebook | 71 % | Pew Research Center, 2025, USA | independent |
| US adults using Instagram | 50 % | Pew Research Center, 2025, USA | independent |
| Facebook use, ages 30 to 49 | 80 % | Pew Research Center, 2025, USA | independent |
| Instagram use, ages 18 to 29 | 80 % | Pew Research Center, 2025, USA | independent |
| German companies (20+ employees) with a social media profile | 80 % | Bitkom Research, spring 2025, Germany, about 600 firms | industry |
| … that use social media to attract employees | 62 % | Bitkom Research, spring 2025, Germany | industry |
| … with a Facebook / Instagram / TikTok profile | 48 % / 35 % / 22 % | Bitkom Research, spring 2025, Germany | industry |
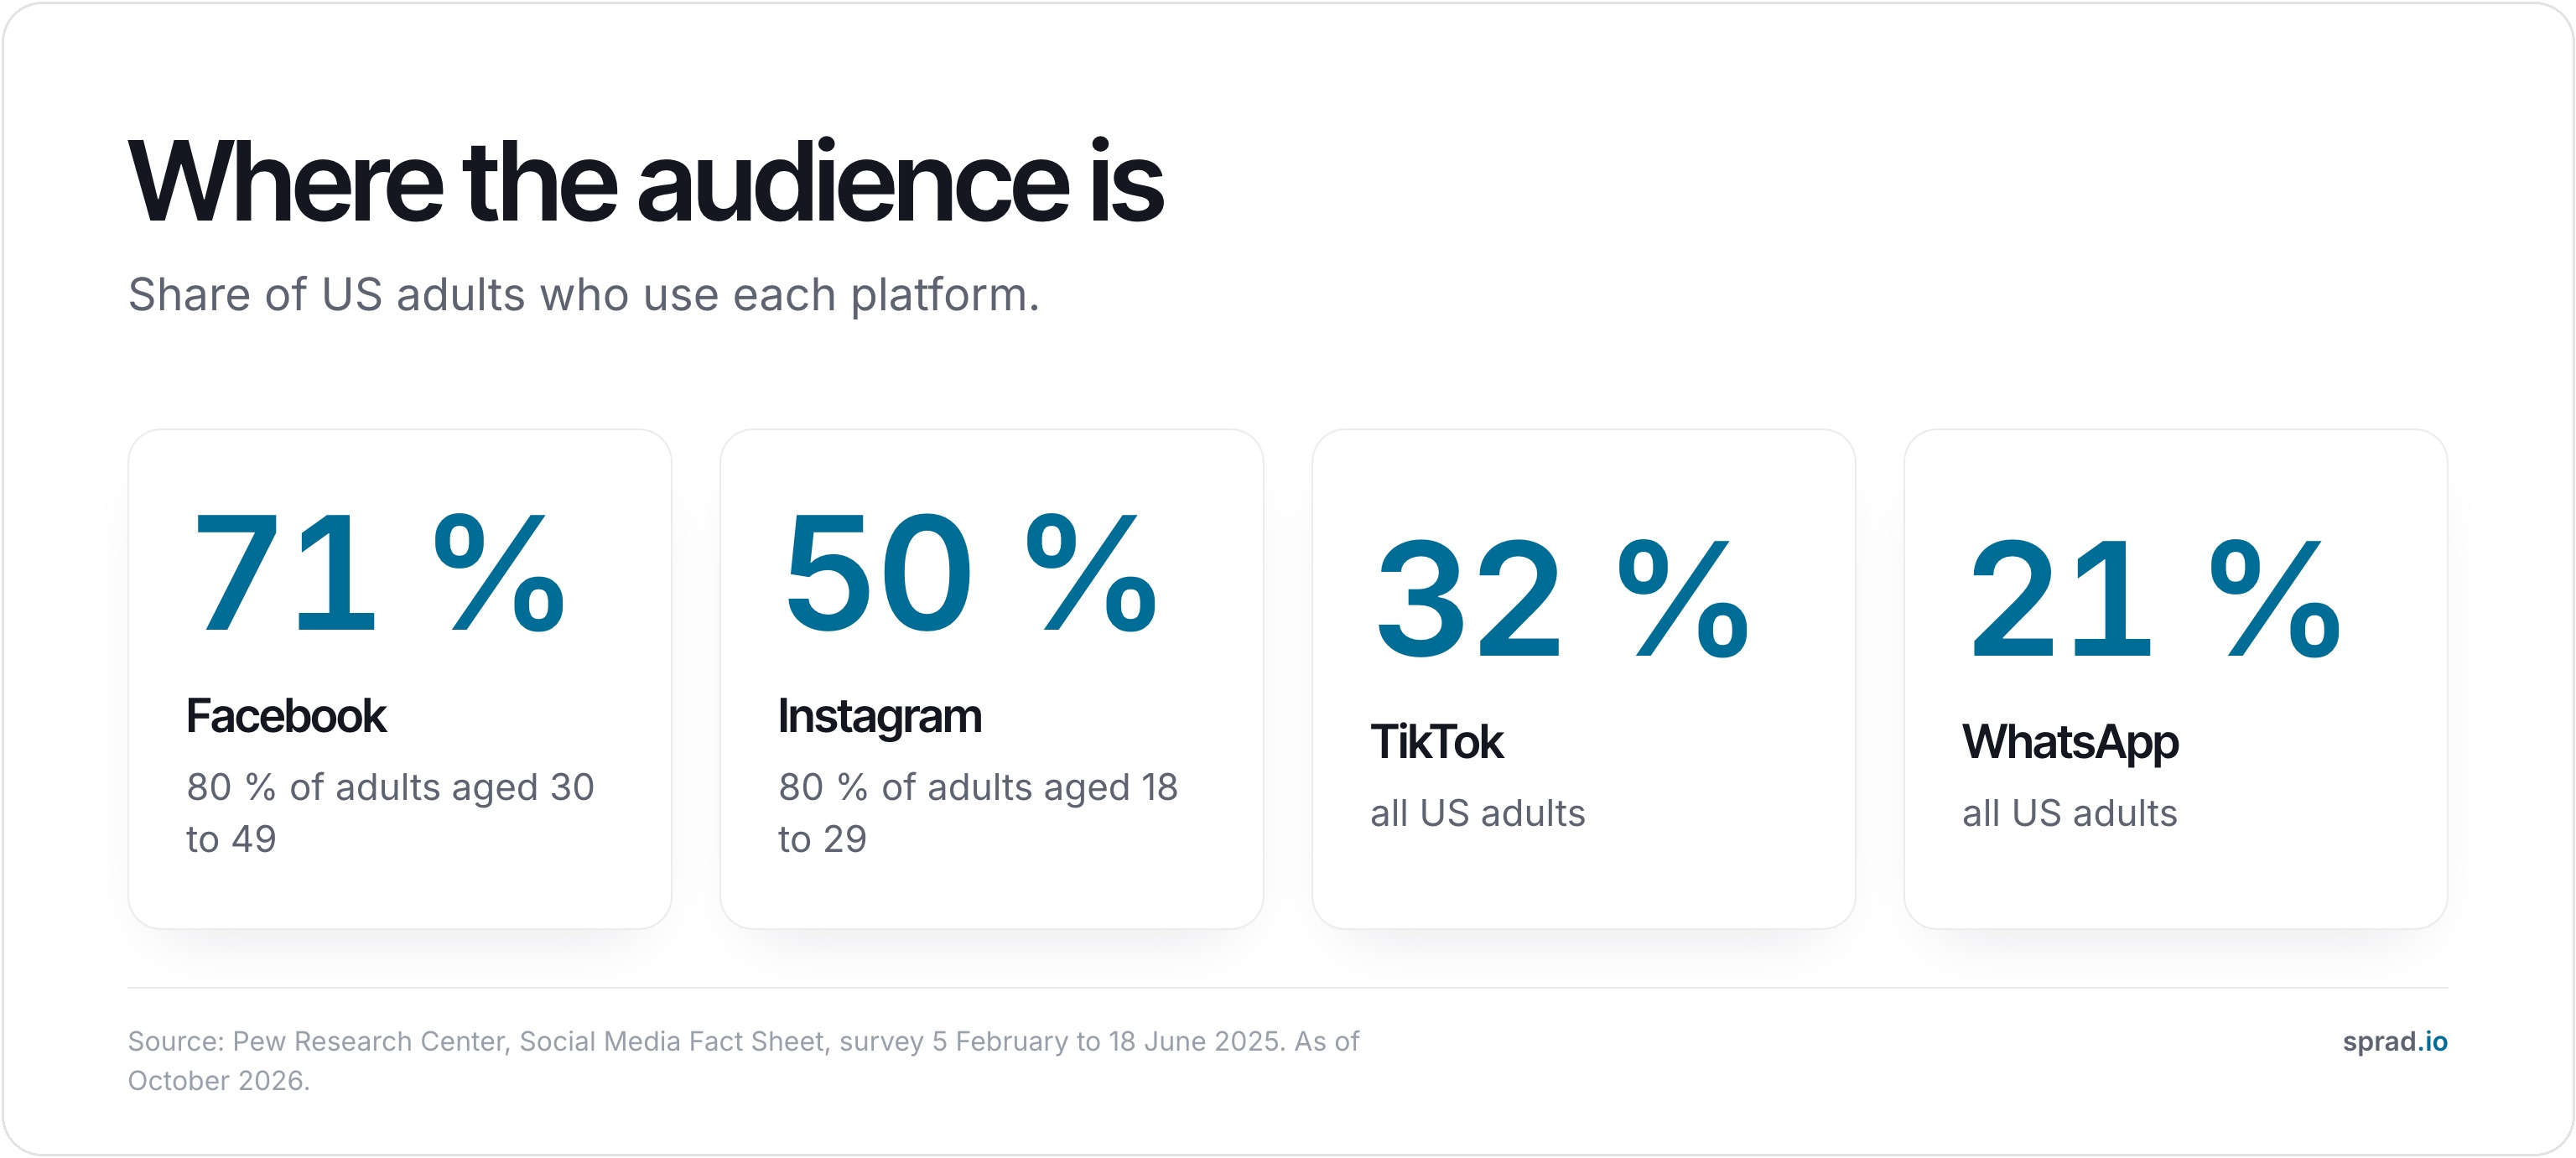
Reading it: the platform audience is large in exactly the age groups that fill frontline jobs. The Bitkom figure shows that most German companies already use social media for recruiting purposes, but it does not say how many run paid job ads. Our guide to reaching frontline staff explains why the phone, not e-mail, is the channel to follow up on.
Shortage: why employers look beyond job boards
The German chamber of commerce (DIHK) asked almost 22,000 companies for its Fachkräftereport 2025/2026. 36 % cannot fill vacancies at least in part because they find no suitable staff, seven points fewer than a year before; 48 % have no hiring need, up from 44 %. By sector, the share with hiring problems is 62 % in civil engineering, 58 % in temporary work, 54 % in road freight and 40 % in hospitality.
The Bundesagentur für Arbeit identified 157 shortage occupations for 2025 (13 % of 1,236 occupations; 2024: 163; 2023: 183). In the US, the BLS JOLTS release for August 2026 reports 7.1 million job openings and 5.2 million hires.
| Statistic | Value | Source, year, country | Type |
|---|---|---|---|
| Firms that cannot fill vacancies | 36 % (previous year 43 %) | DIHK Fachkräftereport 2025/2026, Germany, almost 22,000 firms | independent |
| Firms with no hiring need | 48 % (previous year 44 %) | DIHK Fachkräftereport 2025/2026, Germany | independent |
| Civil engineering firms with hiring problems | 62 % | DIHK Fachkräftereport 2025/2026, Germany | independent |
| Shortage occupations | 157 | Bundesagentur für Arbeit, Engpassanalyse 2025, Germany | independent |
| Job openings / hires | 7.1 million / 5.2 million | BLS JOLTS, August 2026, USA | independent |
Cost: what an applicant costs on Meta
Boostpoint, a US social recruiting agency, published its 2026 benchmark on 12 August 2026: 891 campaigns, 1,334 campaign-months, all on Meta and all managed by Boostpoint. This is vendor data from the US, and costs include campaign management, but it is the largest public data set we found for job ads on Meta.
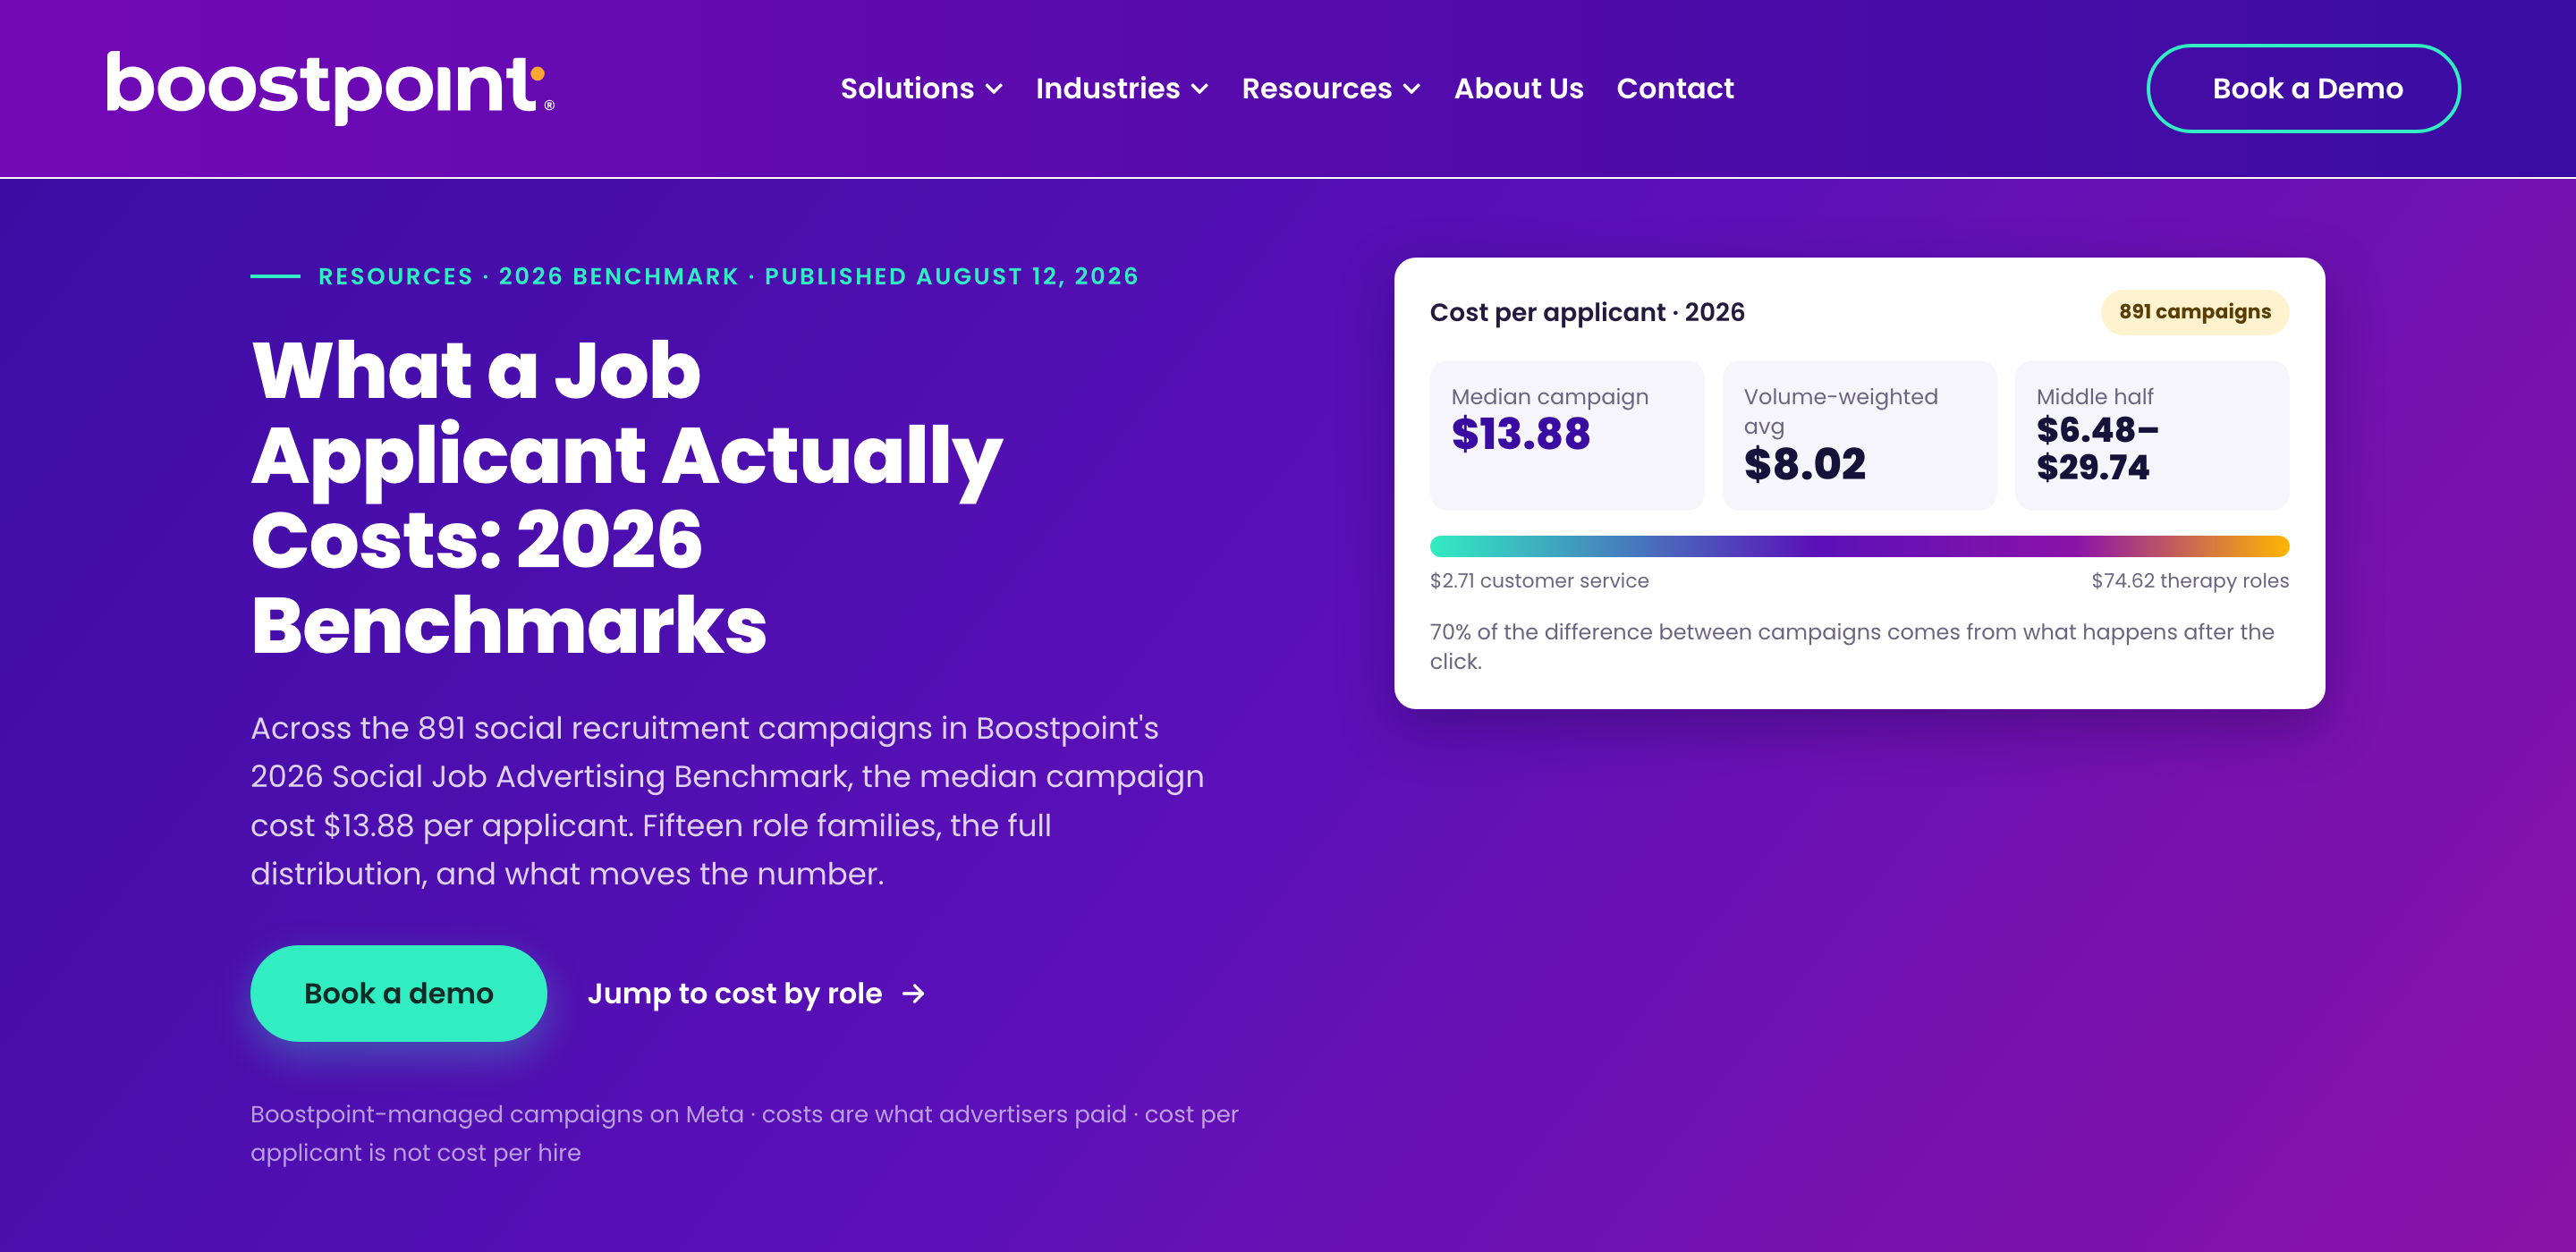
- Median cost per applicant: $13.88. The volume-weighted average is $8.02, because cheap high-volume roles pull it down.
- Middle half of campaigns: $6.48 to $29.74 per applicant.
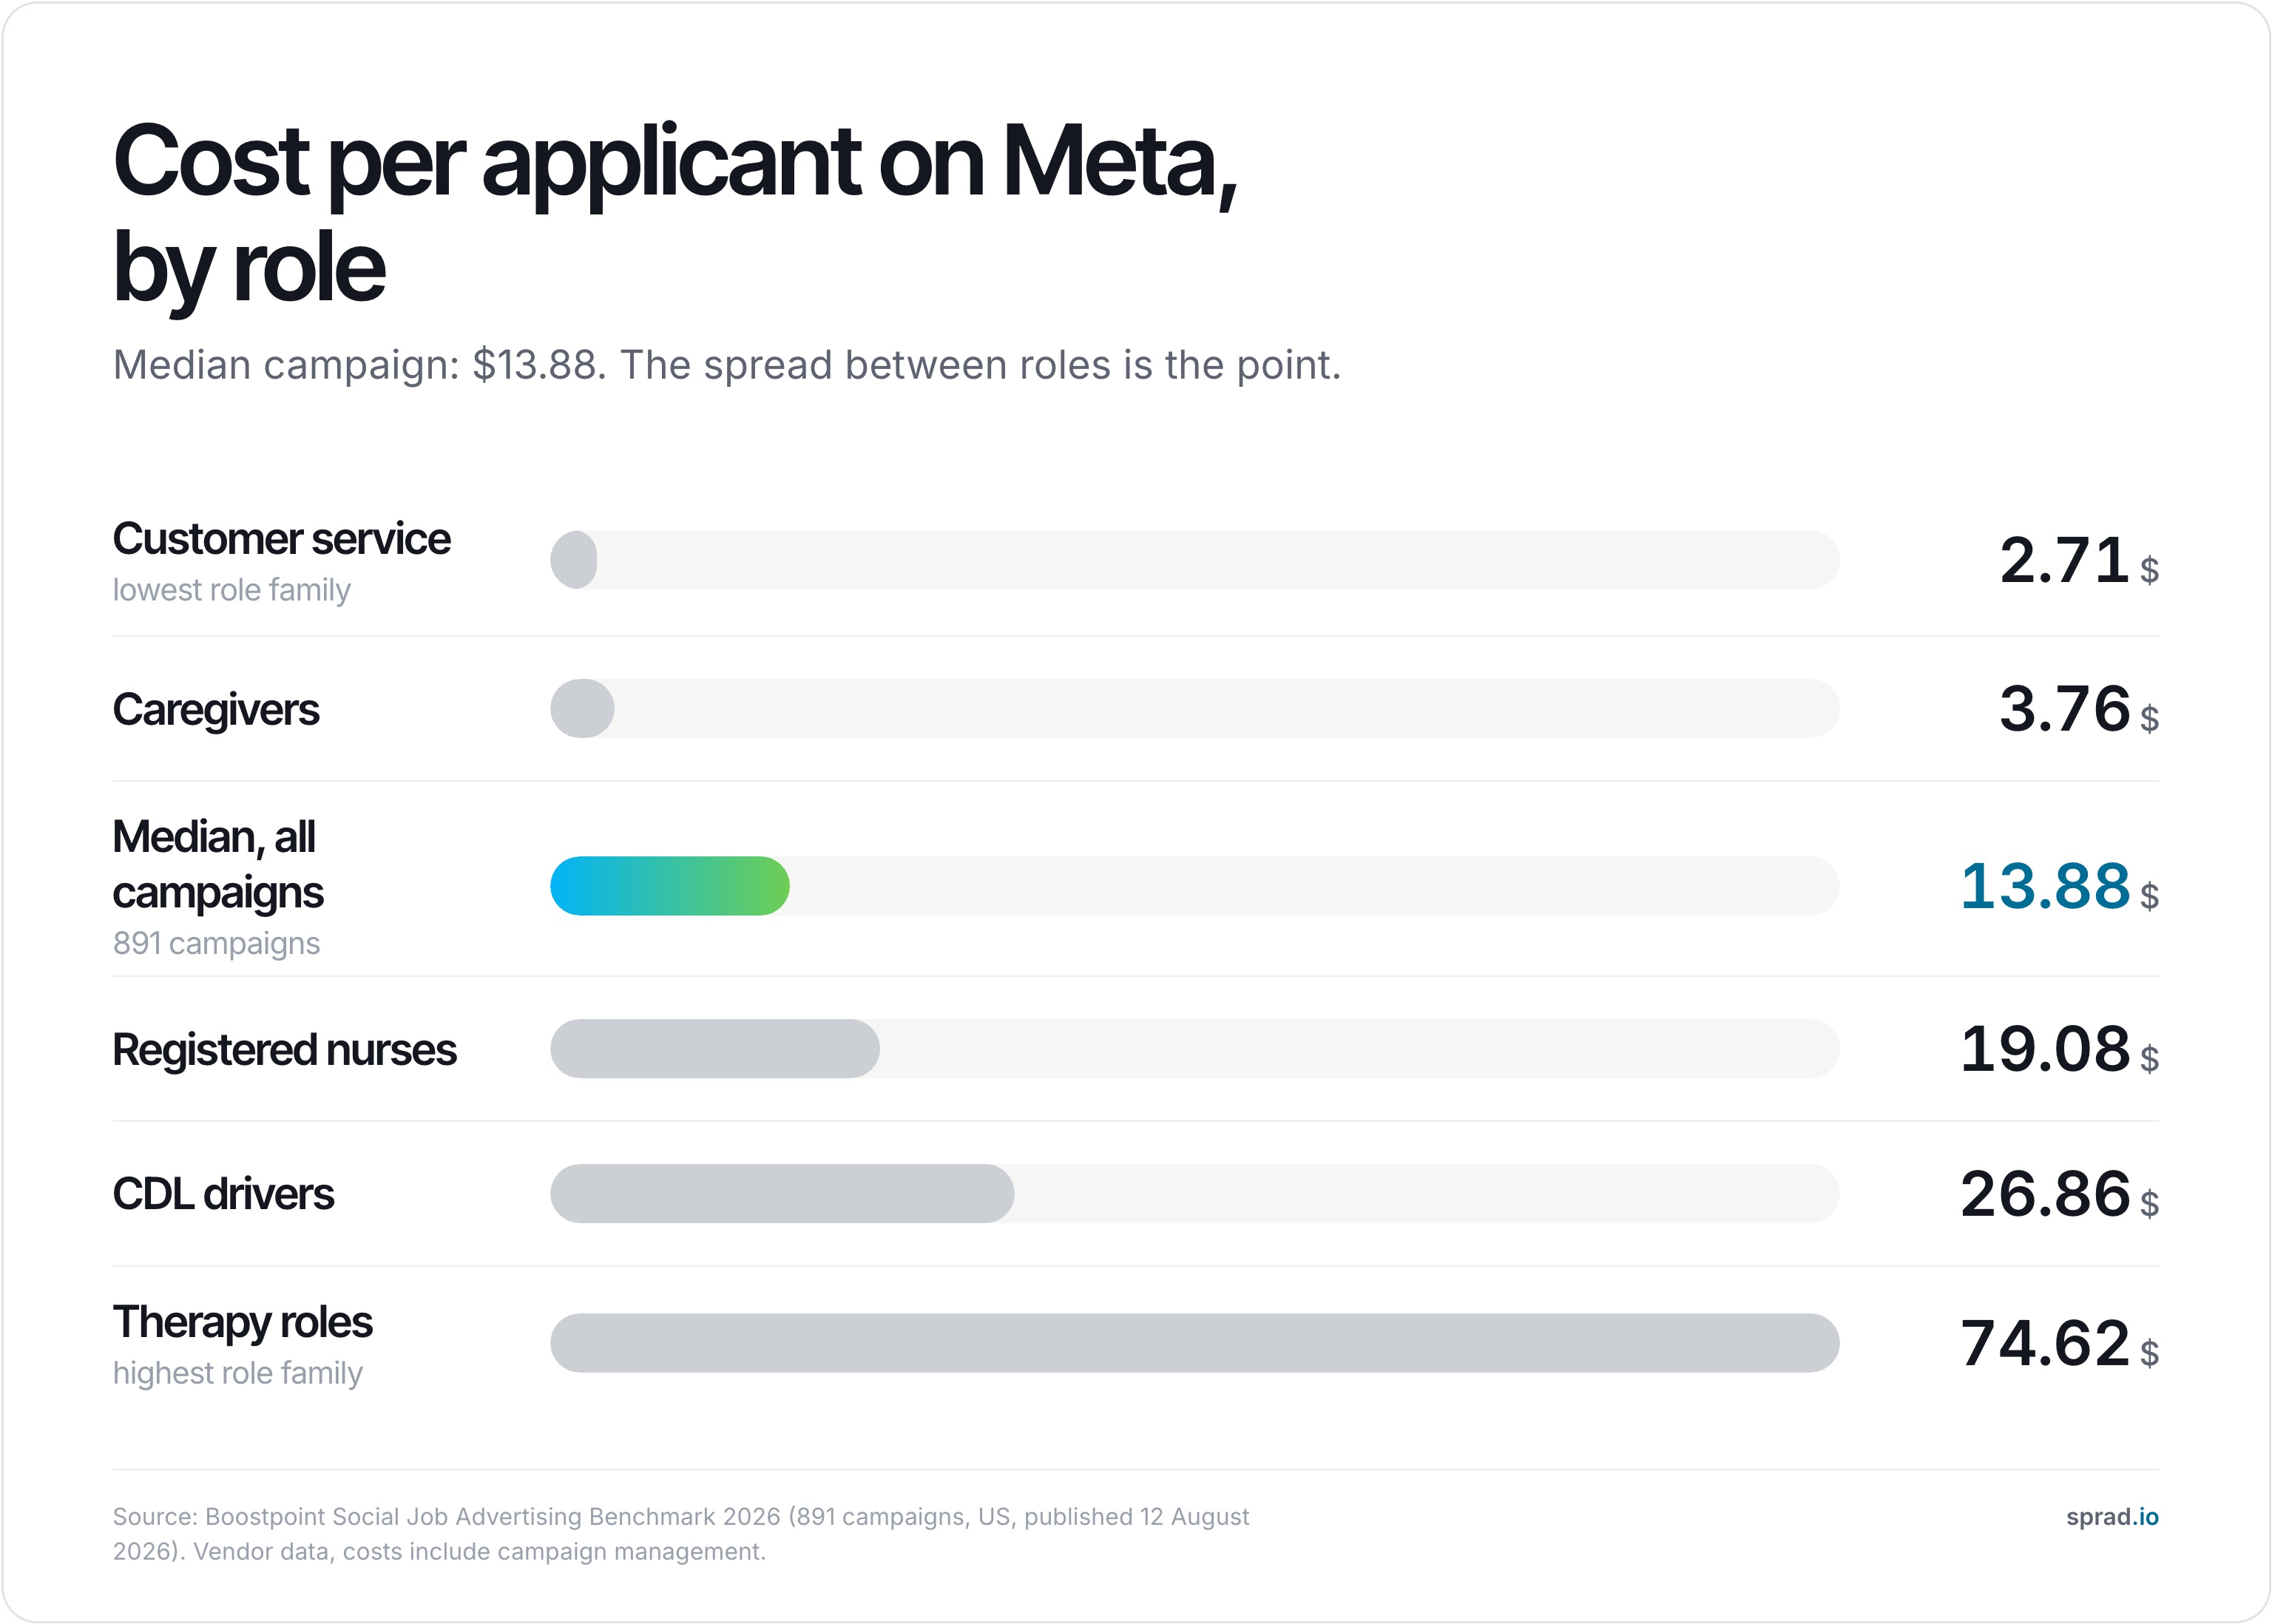
- By role: customer service $2.71, caregivers $3.76, registered nurses $19.08, CDL truck drivers $26.86, therapy roles $74.62.
- What drives the difference: the application completion rate explains 70 % of the gap between campaigns, the price per thousand impressions only 18 %. What happens after the click matters more than the ad auction.
- Budgets are small: half of all campaign-months ran below $334, the upper quartile started around $554.
Appcast’s 2026 Recruitment Marketing Benchmark Report (released 17 February 2026, about 1,200 employers, 302 million clicks, 27 million applications) adds that cost per application and cost per hire on classic job channels rose in 2025. Appcast is a vendor in the StepStone group. We do not quote its dollar figures here because we could not verify them against the full report.
Candidates and AI: what the vendor surveys say
Fountain, a frontline hiring platform, reports that 74 % of about 2,000 surveyed frontline workers prefer dealing with AI over traditional methods when applying (Fountain Frontline Report 2025, vendor data, USA). In the same piece it cites Aptitude Research (early 2026): only 25 % of talent acquisition leaders say their technology is very effective at high-volume hiring. Treat both as signals about speed and first contact, not as general truths.
Rules that shape the numbers
Meta’s Employment ad category fixes age at 18 to 65+, removes gender targeting and blocks postcode targeting. Cost benchmarks from before these rules applied in your country may not transfer. Check the current scope in the Ads Manager. For hiring AI, the EU AI Act’s high-risk duties moved to 2 December 2027, according to law-firm summaries of the Digital Omnibus on AI. This is general information, not legal advice.
A worked example with the benchmark
An illustration, not a forecast: with a budget of 2,000 in dollars and the Boostpoint median of $13.88 per applicant, a campaign would produce about 144 applicants. If a quarter of them fit the must-have criteria after a short pre-screen, that leaves about 36 candidates, or roughly $56 per pre-screened candidate. Nurses at $19.08 or CDL drivers at $26.86 per applicant would produce fewer applicants for the same money. The currency is not converted, and Boostpoint data are US data.
Numbers we do not use, and why
| Claim you will see | Why we skip it |
|---|---|
| “92 % of recruiters use social media” | Repeated across aggregator pages without a traceable study, year or sample |
| “Candidates contacted via social media are 8× more likely to be hired” | No traceable primary source, and the comparison group is unclear |
| “73 % of 18- to 34-year-olds found their last job on social media” | No named study; the age band is unusually specific for an untraceable figure |
| “Social recruiting cuts time-to-hire by 23 %” | Aggregator figure without method; time-to-hire depends strongly on the role |
How to cite this page
If you quote a number from this page, quote the original source it points to: Pew Research Center (Social Media Fact Sheet, 2025), Bitkom Research (2025), DIHK (Fachkräftereport 2025/2026), Bundesagentur für Arbeit (Fachkräfteengpassanalyse 2025), BLS (JOLTS, August 2026) and Boostpoint (2026 Social Job Advertising Benchmark). We will update this page when new editions appear.
What these numbers mean for your next campaign
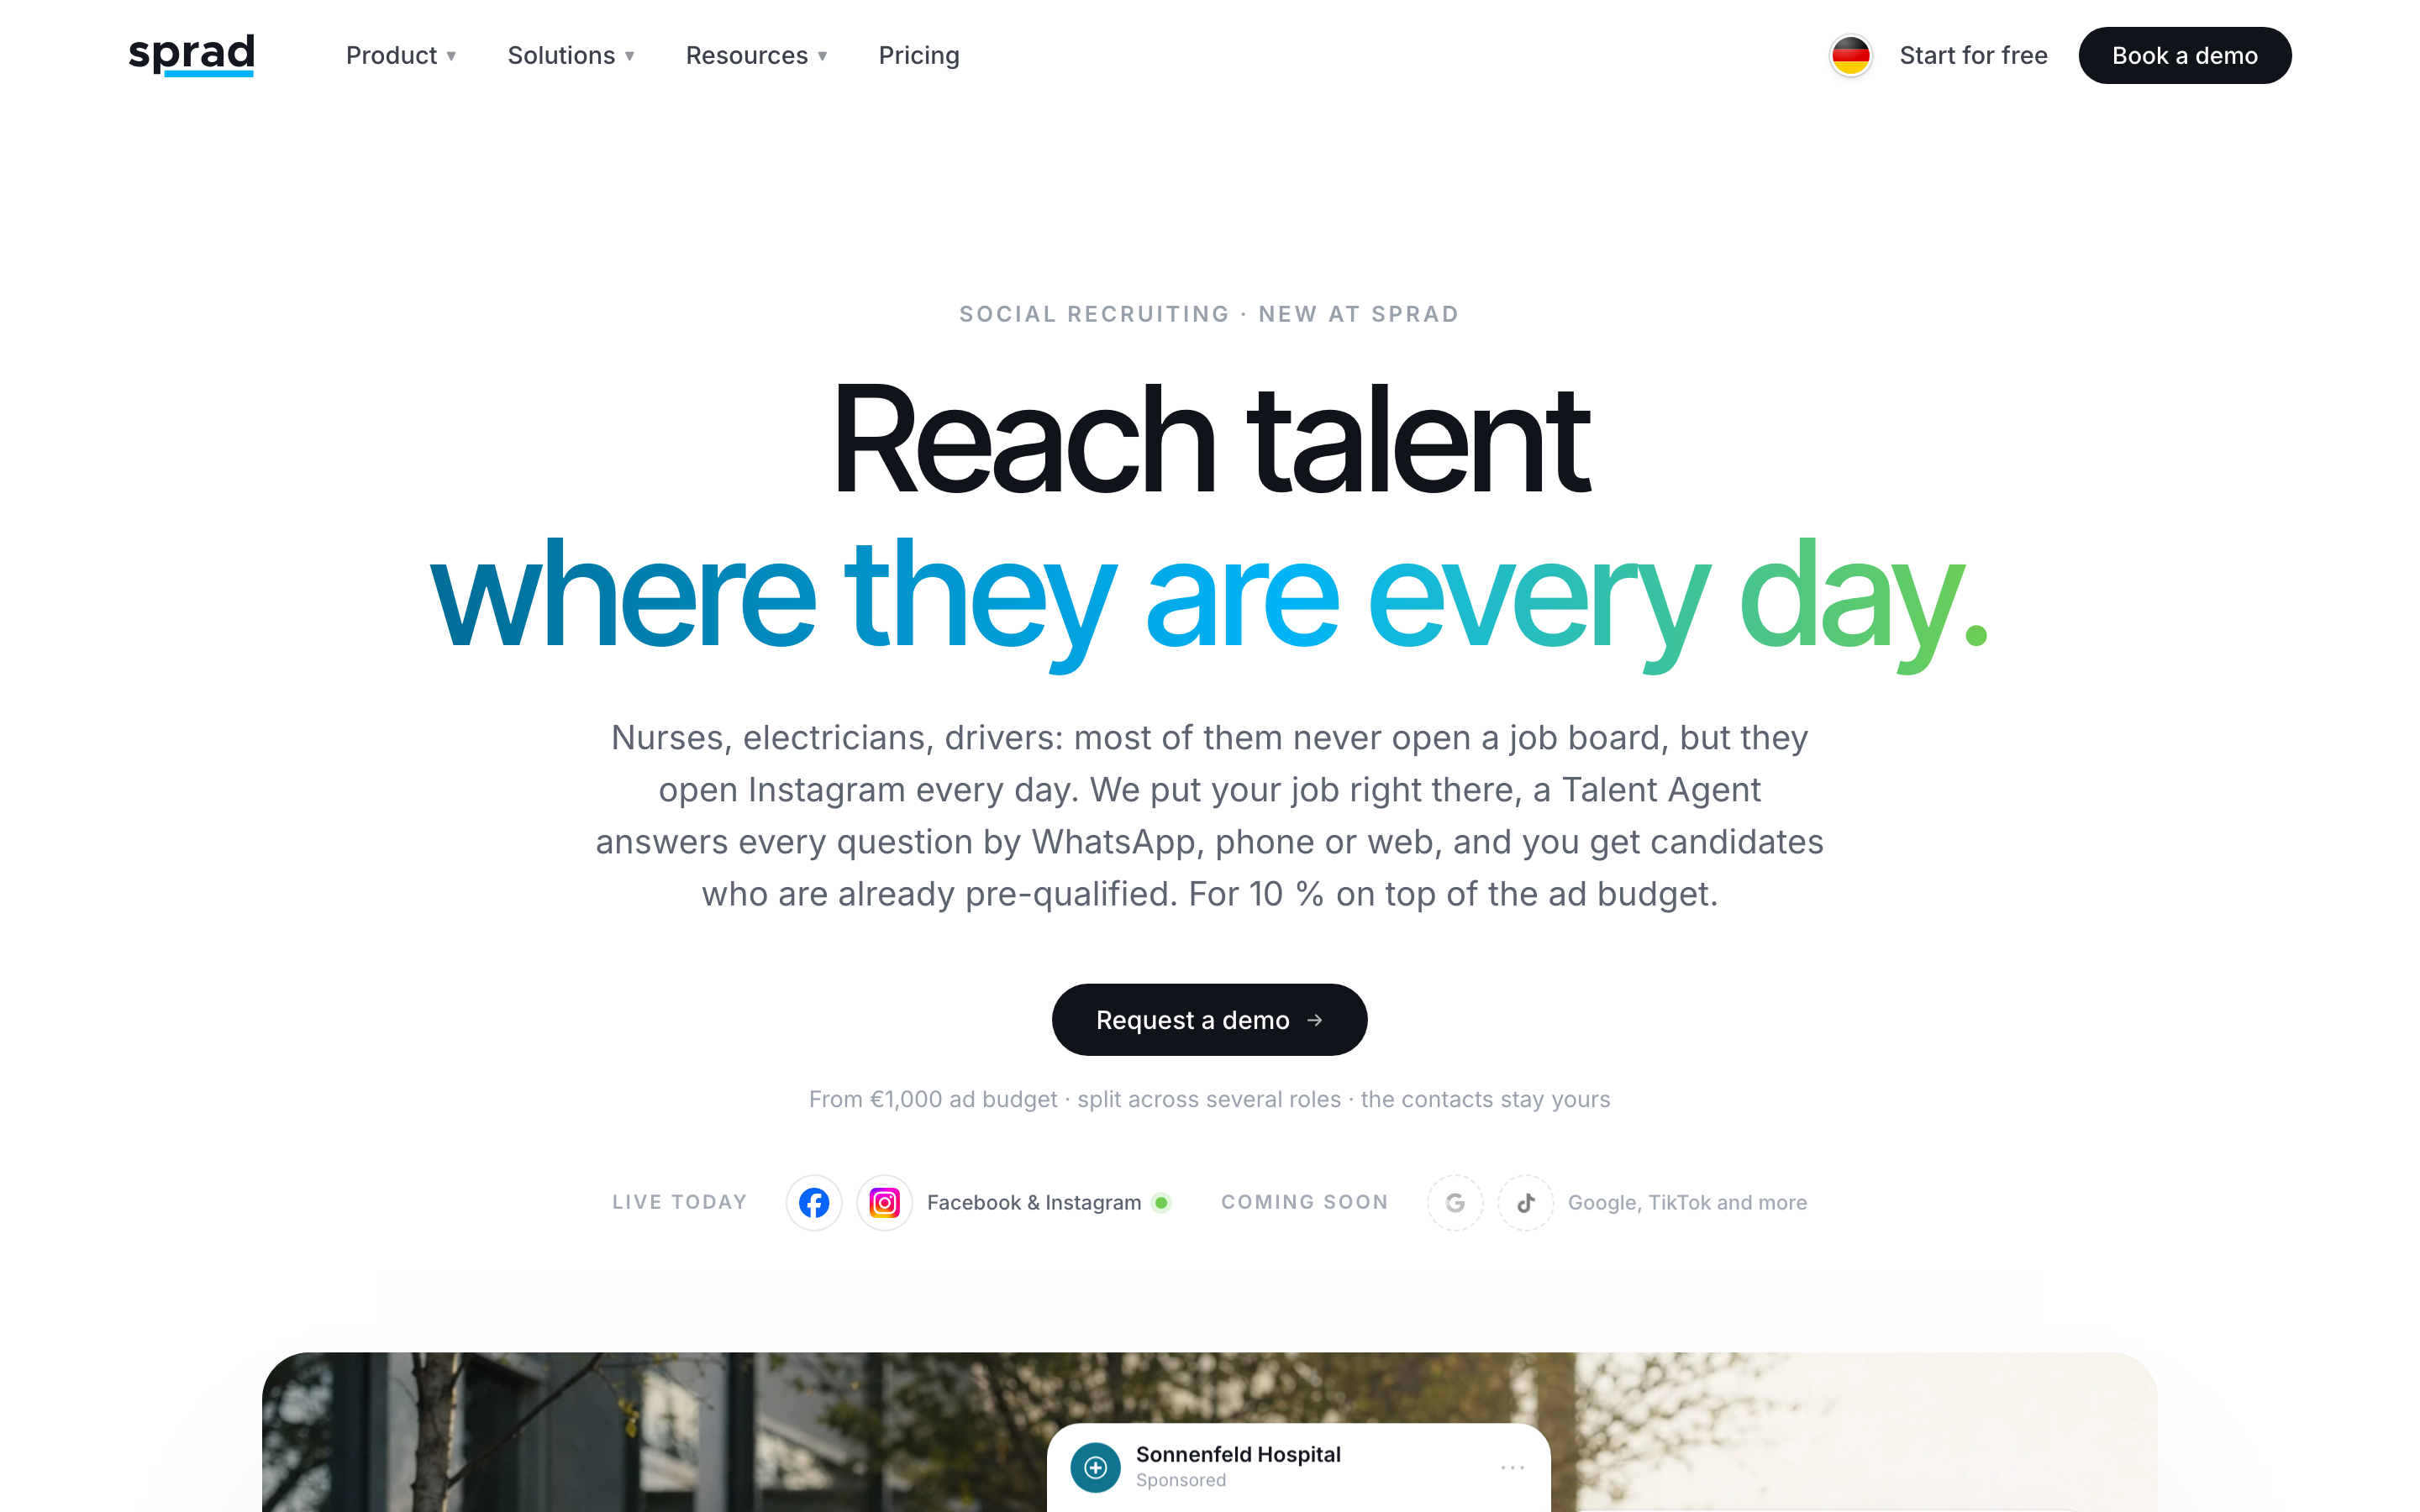
The numbers point in one direction: reach is cheap, applicant quality is not. Sprad Social Recruiting runs job ads on Instagram and Facebook, where nurses, tradespeople, drivers and other frontline workers spend time every day. An AI talent agent pre-screens every applicant via WhatsApp, phone or web, and every applicant lands in your own talent pool, so the relationships stay with you instead of a platform. Pricing is ad spend plus 10 %, from a €1,000 budget that can be split across roles, so a €1,000 budget costs €1,100 in total. There is no guarantee of applicants or hires. See also our healthcare and trades pages.
Frequently asked questions
How many companies use social media for recruiting?
In Germany, 62 % of companies with 20 or more employees use social media to attract employees, according to Bitkom Research (2025). Many of these use unpaid profiles; the figure does not measure paid job ads.
What does a job ad applicant cost on Facebook and Instagram?
The median in Boostpoint’s 2026 benchmark is $13.88 per applicant across 891 US campaigns, ranging from $2.71 for customer service to $74.62 for therapy roles. These are vendor data from the US.
Which social network do most people use?
In the US, Facebook (71 % of adults) and Instagram (50 %) are the largest Meta platforms in the Pew 2025 survey; YouTube leads overall at 84 %.
Is cost per applicant the right measure?
It is a start. Cost per qualified applicant and cost per interview say more, because easy applications attract people who do not meet the must-haves.
Are social recruiting statistics reliable?
Only if the source, year, sample and country are named. Many figures circulate without a traceable study. Prefer statistics offices, chambers and research institutes, and treat vendor data as direction.
Jürgen Ulbrich
Jürgen Ulbrich has more than a decade of experience in developing and leading high-performing teams and companies. As an expert in employee referral programs as well as feedback and performance processes, Jürgen has helped over 100 organizations optimize their talent acquisition and development strategies.