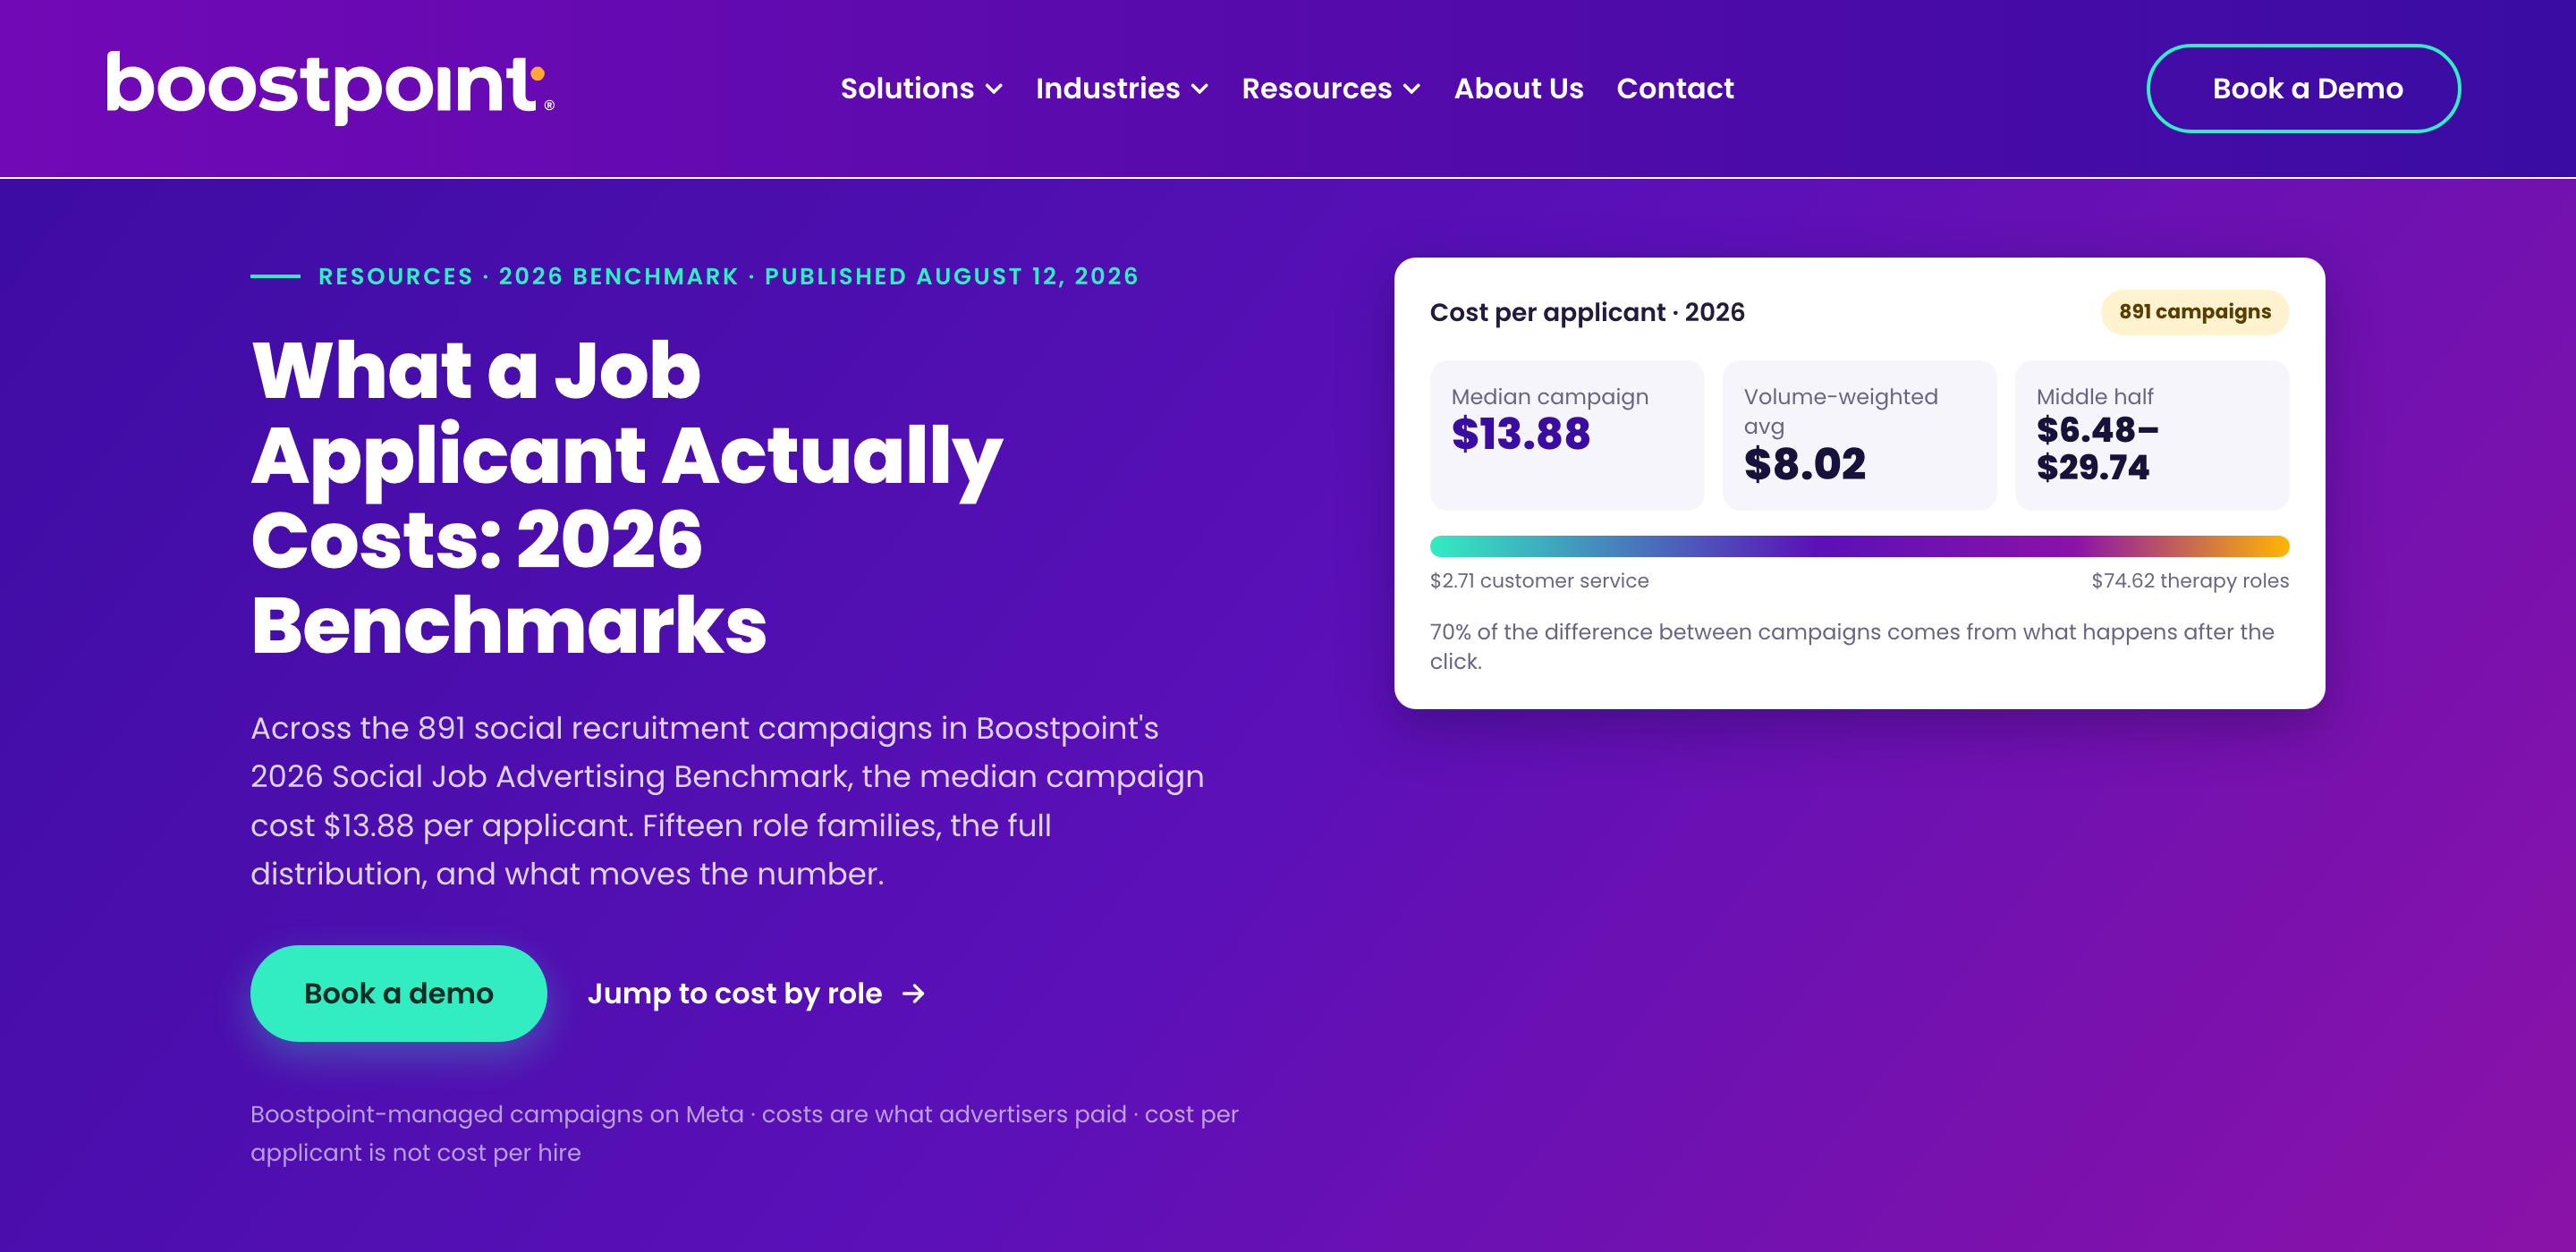
The median Facebook and Instagram job campaign in the US costs $13.88 per applicant (2026 benchmark, 891 campaigns). By role the median runs from $2.71 for customer service to $74.62 for therapists. For Germany, Austria and Switzerland, TalentBait reports €30 to €80 per application on Facebook and Instagram. Treat every figure as the top of the funnel: an applicant is a submitted form, not an interview and not a hire.
What counts as an "applicant"?
Before you compare numbers, compare definitions. The US benchmark counts an applicant as a completed lead-form submission, not a click. It includes the provider's management fee, and it leaves out 169 traffic campaigns that had no form. The DACH figure speaks of "qualified" applications, but the provider does not publish what qualifies. So the two sets of numbers are neighbours, not twins.
Cost per applicant by role
The table shows the median campaign per role family, plus the middle half of campaigns (25th to 75th percentile). Read the range, not just the median: a role with a wide range, such as therapy or behavioural health, is hard to plan.
| Role family | Median | Middle 50 % |
|---|---|---|
| Customer service / admin | $2.71 | $2.14 – $7.47 |
| Caregiver / home care | $3.76 | $2.99 – $5.83 |
| CNA / nursing assistant | $7.72 | $6.18 – $12.06 |
| Warehouse / production | $9.83 | $3.15 – $18.72 |
| Sales | $11.61 | $5.99 – $21.17 |
| LPN / LVN | $12.77 | $7.53 – $21.46 |
| Technician / mechanic | $13.41 | $7.40 – $23.58 |
| Skilled trades | $14.14 | $7.58 – $21.49 |
| Management / professional | $16.87 | $4.62 – $60.11 |
| Registered nurse | $19.08 | $12.76 – $34.84 |
| CDL truck driver | $26.86 | $17.00 – $42.31 |
| Teacher / instructor | $30.95 | $16.60 – $56.74 |
| Allied health / imaging | $54.37 | $10.27 – $106.51 |
| Behavioural health / DSP | $55.55 | $18.36 – $334.56 |
| Therapy (PT/OT/SLP) | $74.62 | $44.85 – $171.40 |

The pattern is simple. Roles with a large local pool and a short form (customer service, caregivers, warehouse) are cheap. Roles that need a licence, a certificate or a rare skill (nurses, drivers, therapists) cost several times more, because fewer people in the audience can apply at all.
Cost per applicant by sector
| Sector | Median | Middle 50 % |
|---|---|---|
| Retail / corporate | $8.58 | $3.72 – $17.76 |
| Skilled trades and field service | $11.89 | $6.50 – $24.89 |
| Transportation and logistics | $13.34 | $5.26 – $25.17 |
| Healthcare and senior living | $15.42 | $7.89 – $39.61 |
| Behavioural and education | $27.50 | $15.35 – $76.67 |
Source for both tables: Boostpoint 2026 Social Job Advertising Benchmark, published 12 August 2026, Meta campaigns managed by the provider in the US. The volume-weighted average is lower than the median ($8.02), because large, efficient campaigns pull it down.
Outside the US: Germany, Austria, Switzerland and the UK
There is no neutral, role-level benchmark for DACH or the UK yet. What exists are provider figures. TalentBait, a Hamburg provider, publishes cost ranges per application by channel, based on its own campaigns (2023 to 2025). It states that all values are averages that vary by region and industry.
| Channel (DACH) | Cost per application | Typical use |
|---|---|---|
| Facebook and Instagram | €30 – €80 | trades, care |
| TikTok | €25 – €70 | apprentices, hospitality |
| eBay Kleinanzeigen | €25 – €65 | trades, logistics |
| Google Search | €50 – €120 | all professional groups |
| €60 – €150 | IT, sales, management |
Source: provider page on social recruiting costs, as of October 2026, definition of "qualified" not published. For the UK, one provider claims a 60 % lower cost per application than job boards, without a published baseline. Treat that as a marketing claim, not a benchmark. We deliberately do not convert dollars into pounds or euros here: exchange rates, wages and campaign design differ too much for a clean one-to-one comparison.
What actually moves the number
The benchmark's own analysis answers this better than any rule of thumb. Application completion rate explains 70 % of the variation in cost per applicant, click-through rate 30 % and cost per 1,000 impressions 18 % (the shares overlap). In plain words: what happens after the click matters more than what the ad costs.

A form that fewer than 5 % of visitors finish costs a median $53.77 per applicant. At over 35 % completion it costs $1.61. The same budget buys more than thirty times as many applicants.
Frequency matters too. When the same person sees your ad too often, the price climbs:
| Monthly ad frequency | Median cost per applicant |
|---|---|
| Under 1.5 | $7.85 |
| 1.5 – 2.0 | $11.48 |
| 2.0 – 2.5 | $13.39 |
| 2.5 – 3.0 | $13.65 |
| 3.0 – 4.0 | $18.76 |
| Over 4.0 | $26.78 |
From cost per applicant to cost per hire
Nobody hires an "applicant". The honest formula is: cost per hire = cost per applicant ÷ share of applicants who end up hired. The benchmark itself warns that any cost per hire derived from ad data is an extrapolation. So here is arithmetic, not a forecast, with an explicit assumption:
| Role family | Applicants per 1,000 spent | Cost per hire if 1 in 25 applicants is hired (assumption) |
|---|---|---|
| Caregiver / home care ($3.76) | about 266 | about $94 |
| Warehouse / production ($9.83) | about 102 | about $246 |
| Overall median ($13.88) | about 72 | about $347 |
| CDL truck driver ($26.86) | about 37 | about $672 |
The "1 in 25" is an assumption, not a measurement. In your own process the ratio could be 1 in 8 or 1 in 60, and that single number changes the result more than the choice of provider. Measure it from your first campaign.
Five questions before you trust any benchmark
- Applicant or click? A form submission, a started chat and a landing-page visit are different things.
- Fees included? Does the figure include the agency or platform fee, or only the media spend?
- Which country and role? A US caregiver and a UK care assistant face different wages and competition.
- Median or average? The median is the typical campaign, the weighted average is the typical dollar.
- Who measured? A provider selling the service has an interest. Look for sample size and method.
How to get a lower cost per applicant
- Shorten the path. Mobile form, a handful of questions, no CV upload, no account. Completion rate is the biggest lever.
- Keep frequency in check. Rotate creatives and widen the audience before the same person sees the ad three times a month.
- Answer fast, on the channel people use. Frontline applicants answer a phone call or a WhatsApp message, rarely an email. See our guide on why frontline recruiting runs on phone and WhatsApp.
- Screen before a human spends time. A cheap applicant who never replies is expensive. Compare how screening for blue-collar roles differs from white-collar roles.
- Pick the role family on purpose. If a role is scarce, plan the budget for the upper half of its range.
Industry context for your planning: logistics, healthcare and trades.
Where Sprad fits
Sprad Social Recruiting runs job ads on Instagram and Facebook, where nurses, tradespeople, drivers and other frontline workers spend time every day. An AI talent agent pre-screens every applicant via WhatsApp, phone or web. Every applicant lands in your own talent pool, so the relationships stay with you instead of a platform. Pricing is ad spend plus 10 %, from a €1,000 budget that can be split across roles.
One honest note: we do not publish a cost-per-applicant benchmark of our own until we have evaluated enough campaigns. The budget guide on the product page is guidance, not a guarantee. See Sprad Social Recruiting and the talent pool.
FAQ
What is a good cost per applicant on Facebook and Instagram?
In the 2026 US benchmark the median is $13.88 and the middle half of campaigns lands between $6.48 and $29.74. "Good" depends on the role: $5 is excellent for a truck driver, but ordinary for a caregiver.
How much does a blue-collar applicant cost?
In the US benchmark: warehouse and production $9.83, skilled trades $14.14, technicians $13.41, CDL drivers $26.86 (medians). For DACH, one provider reports €30 to €80 per application on Facebook and Instagram.
Is cost per applicant the same as cost per hire?
No. An applicant is a submitted form. Cost per hire also depends on how many applicants respond, pass screening and accept. Divide the cost per applicant by your own applicant-to-hire ratio.
Why do some roles cost 20 times more than others?
Licensed or scarce roles have small audiences, and longer forms or credentials lower completion. That is why therapy ($74.62) costs about 27 times customer service ($2.71).
Does a higher budget lower the cost per applicant?
Not by itself. A higher budget raises ad frequency in a small audience, and frequency over 4 pushes the median to $26.78. Spread the budget across more roles or a wider audience instead.
Jürgen Ulbrich
Jürgen Ulbrich has more than a decade of experience in developing and leading high-performing teams and companies. As an expert in employee referral programs as well as feedback and performance processes, Jürgen has helped over 100 organizations optimize their talent acquisition and development strategies.